


 10% Gloves
A case on G4Skins, first seen 2 Nov 2026. Every value is G4Skins's own item price.
Price
$6.90
Advertised RTP
84.32%
EV $5.82 from 15 items
Observed RTP, 30d
92.85%
10.1K openings, odds method
Variance
7.6×
of price², per opening
Tail share
1 in 29
of openings carry half the EV
Below price
90.0%
of openings return less than the price
Advertised vs observedper window, 95% band and the advertised marker
observed, 95% bandadvertisedoutside bandsmall sample
Outside band, 30 days. Advertised 84.54% sits outside the 95% band of the observed openings (87.44% – 98.26%, 10,134 openings, 30 days). The band comes from the site's own odds and values; the figure is a fact about these openings, not a verdict on the case.
Windowsthe test per window
Enough sample: 100 openings and 5 expected rare hits (odds method) or 1,000 openings (sample method).
Items, odds and values15 items · odds sum to 1 · observed counts over 10.1K openings, 30 days
Share of the expected value, most valuable first; colour is the item's rarity.

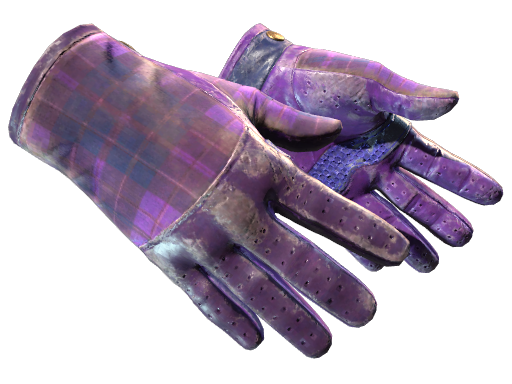
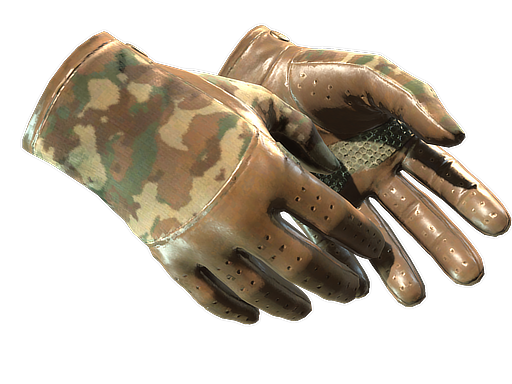

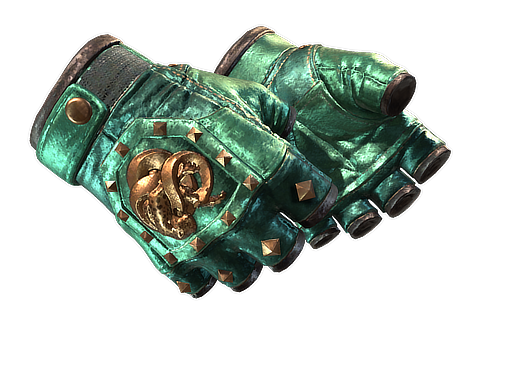
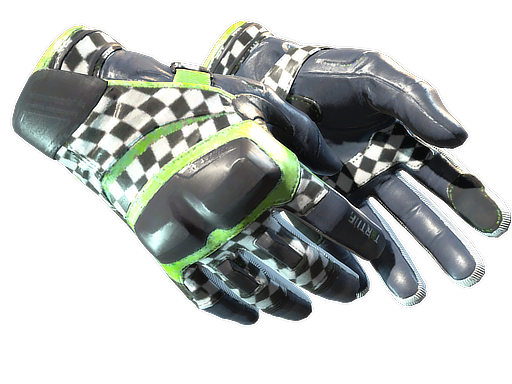
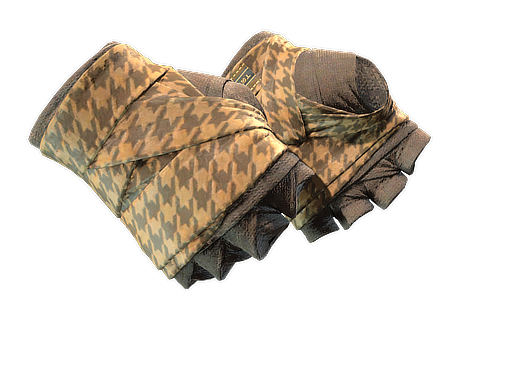
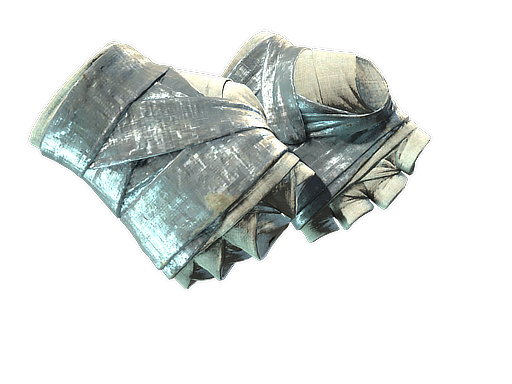
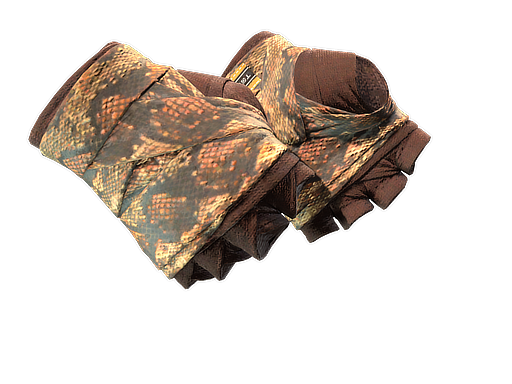
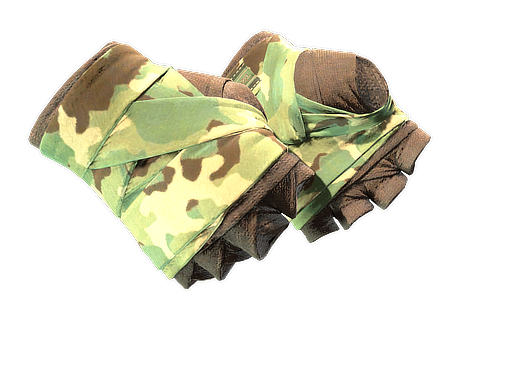
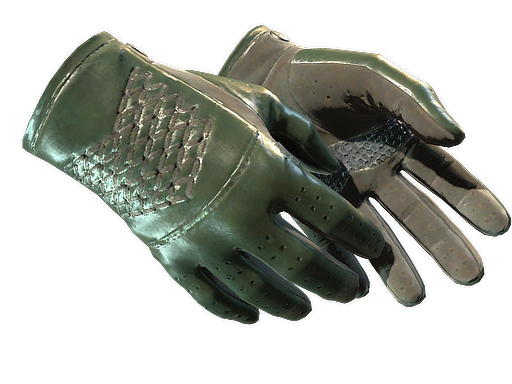

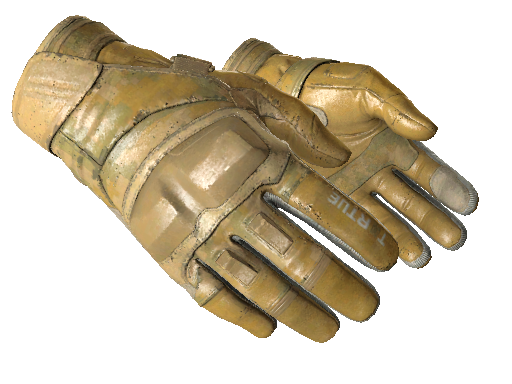
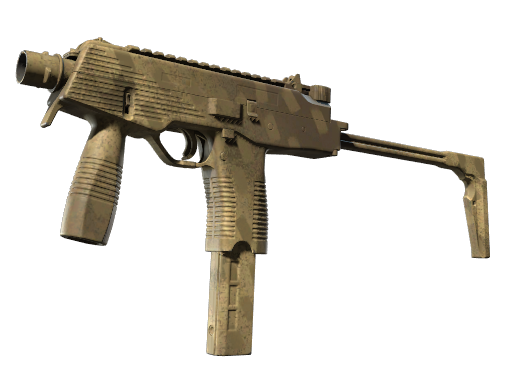
Values are G4Skins's own item prices; EV share = odds × value ÷ EV. Hot / cold compares observed drops of each item with odds × openings; small expected counts are left blank. Odds read from
g4skins:feed/cases/105, 11 Nov, 11:37 UTC.Biggest dropsfrom this case, by value
No drops yetNo drop from this case seen yet.
Latest dropsnewest first
Observed RTP over timedaily, 30 days
Observed RTP, dailyAdvertised 84.32%
Catalog changesprice, advertised RTP and contents, per capture
| Captured | Price | Advertised | Items |
|---|---|---|---|
| 5 Nov, 18:07 UTC | $6.90 | 84.32% | 15 |
| 2 Nov, 21:40 UTC | $7.70 | 84.21% | 15 |
Each opening is tested against the capture in force when it happened; a price or odds change starts a new one.
listedextraordinary 10.0%consumer 90.0%best hit —